Measuring Operational Impact After Document Review Automation
Track extraction accuracy and cycle time at each step, not just tool logins.

Measuring operational impact after document review automation means tracking a structured set of leading and lagging indicators, not counting how many people logged into a tool. Most organizations never build that structure, and the result is a familiar outcome: automation gets deployed everywhere and proves its worth almost nowhere.
Why Document Automation Deployments Fail to Prove Their Value
Enterprise AI has followed a strange path over the last several years: companies roll the technology out at scale, then find themselves unable to show what it actually did for the business. Document automation fits this pattern exactly. The failure is organizational. Research on adoption telemetry draws a line between "active users," people who touched a tool at least once, and workers whose day-to-day work was actually restructured by it. A standard usage dashboard cannot tell these two groups apart, and that blind spot is where most automation programs quietly fail. The analyst world already has names for what happens next: pilot purgatory, pilot fatigue, AI theater, the GenAI divide. None of these terms are in dispute. MIT's NANDA initiative, in its report "The GenAI Divide: State of AI in Business," found that 95% of generative AI pilots delivered no measurable P&L impact. A team can build a document pipeline that extracts, classifies, and routes with real skill, and still end up with nothing to show finance, because nobody instrumented the signals that would have proven it worked. Call it what it is: pilot theater. The rest of this piece is about avoiding it.
What makes document review automation genuinely hard to measure
Part of the difficulty is structural. A document pipeline is a chain of dependent steps, ingestion, classification, extraction, validation, routing, and whatever downstream action the document triggers, and a gain at one step doesn't automatically carry through to the next. A classifier that improves by ten points can still feed a validation queue that chokes on the new volume. If you only measure the aggregate, you miss exactly where the chain is breaking. The adoption side compounds this. Research on adoption telemetry shows that in most monitored enterprise populations, most AI users spend a negligible share of working hours inside the tool, and only a few reach a level of use that's genuinely built into their daily workflow. Breadth of adoption isn't the issue here; depth is. Active users, license utilization, retention rates: these numbers just tell you how many people opened the application. They say nothing about whether the underlying work changed. That mismatch between the instrument and the question is why ROI claims built on usage data collapse under scrutiny. None of this means gains aren't real. Alice Labs' AI Automation ROI Benchmark Report 2026 found that enterprise-wide ROI depends on baseline measurement, workflow redesign, adoption, governance, and cost discipline together, and that which platform a company picks matters less than whether it redesigns at least one high-volume workflow from end to end. Teams often respond that they do measure things, tracking time-to-process or error rates somewhere in a spreadsheet. The trouble is that these numbers are usually lagging, frequently self-reported, and rarely tied to what happened downstream. They confirm that something was done. They don't confirm that it was worth doing.
Why pre-deployment baselines are the prerequisite every team skips
A number collected after launch only means something when there's a documented number from before launch to set it against, and most teams start measuring the day the pipeline goes live, which makes an honest comparison impossible from the outset. Before go-live, a team needs to know the current cycle time per document type, the error rate broken out by category, the true cost-per-document (labor hours multiplied by loaded rate), the volume of documents currently requiring human escalation, and the data quality already flowing into the systems the pipeline will feed. Document type matters a great deal here: invoice processing, contract review, prior authorization, and onboarding forms each carry different baseline error patterns and different tolerances for automated mistakes, so a single blended baseline across all of them hides which specific workflow is actually getting better. Workflow redesign, not just the act of installing a tool, is what produces documented ROI. Alice Labs' 2026 benchmark names workflow redesign as one of the main drivers of ROI, alongside baseline measurement, adoption, governance, and cost discipline. The baseline has to capture the state of the workflow before it was redesigned. Adoption telemetry research finds that only about 2% of the total workforce ever reaches a level of genuinely embedded workflow change, so most "before" snapshots are really just before-the-tool snapshots dressed up as before-the-change ones. Skipping the baseline leaves a team defending its automation with activity proxies, documents processed, time saved as someone estimated it, rather than with a real before-and-after comparison. Those are the conditions that produce pilot theater instead of proof.
Leading indicators: the signals that tell you early whether the pipeline is working
Leading indicators live at the process layer: extraction accuracy, the distribution of confidence scores, escalation rates, and cycle time at each handoff. They move early, well before the business-level numbers shift, and they tell you whether the thing is working before finance ever asks. You need to measure extraction accuracy field by field and document type by document type, as distinct figures rather than one blended one. A pipeline that nails the vendor name on an invoice but drops the line-item amounts has a strong headline score and is still not ready for accounts-payable automation. Confidence scores deserve the same scrutiny. Looking at the distribution of confidence scores across a live population of documents will often reveal miscalibration: a system reporting unusually high confidence on a document type it has never really seen before is a warning. Calibration is what matters. Escalation rate, the share of documents a pipeline sends to a human, tells a similar story in reverse. If that rate drops too low too fast, the more likely explanation is that the system is committing to decisions it shouldn't, not that it has suddenly gotten better. Cycle time needs to be measured at each stage of the pipeline rather than end to end, because a fast extraction step sitting in front of a slow validation queue still produces a slow outcome overall, and the aggregate number will hide exactly that. One failure mode deserves particular attention: fields or rows dropped silently during extraction from tables, line items, or multi-page forms. A system that returns a confident-looking result without flagging what it left out will generate downstream errors that are almost impossible to trace back to the document layer later. For pipelines built around agents rather than fixed extraction steps, the same logic extends further, to tool-call success rates, memory retrieval accuracy, and orchestrator error rates, all of which predict whether the agent is staying inside its guardrails before any failure becomes visible to the business.
Lagging indicators: the business-level outcomes that justify the investment
Lagging indicators, cost-per-document, straight-through processing rate, downstream error rate in receiving systems, and time-to-decision, are what translate pipeline performance into a business case. They only mean something once the leading indicators above are clean. Cost-per-document should be calculated as total cost, model inference, human review hours, infrastructure, and exception handling, divided by the volume of documents processed, and it has to be compared against the pre-deployment baseline cost to produce a comparison anyone can defend. Vendor-published cost figures almost always leave out implementation cost, so they make poor benchmarks on their own. Straight-through processing rate, the share of documents that complete the pipeline with no human touch at all, reflects model accuracy and threshold calibration working together, not model accuracy alone. A rising STP rate paired with a stable or falling downstream error rate is real improvement. But when a rising STP rate pairs with rising downstream errors, the escalation threshold is set wrong, and the system is letting bad documents through uncaught. Downstream data quality, the error rate inside the ERP, CRM, claims system, or agent memory that the pipeline feeds, is the most honest measure available, because it captures what actually reached the next consumer of the data rather than what the pipeline claimed to produce. Silent extraction failures surface here, in downstream data quality. Time-to-decision matters most in workflows where speed carries direct business value, prior authorization in healthcare, trade finance, contract review, and it's also the gain that business stakeholders notice fastest, because they feel it directly. One fair objection is that lagging indicators take too long to move to be useful in a short pilot. That's a real constraint, and it's the strongest argument for instrumenting leading indicators early: teams that do can use them as a reliable proxy while the lagging numbers accumulate behind them.
How the pipeline architecture determines what you can measure
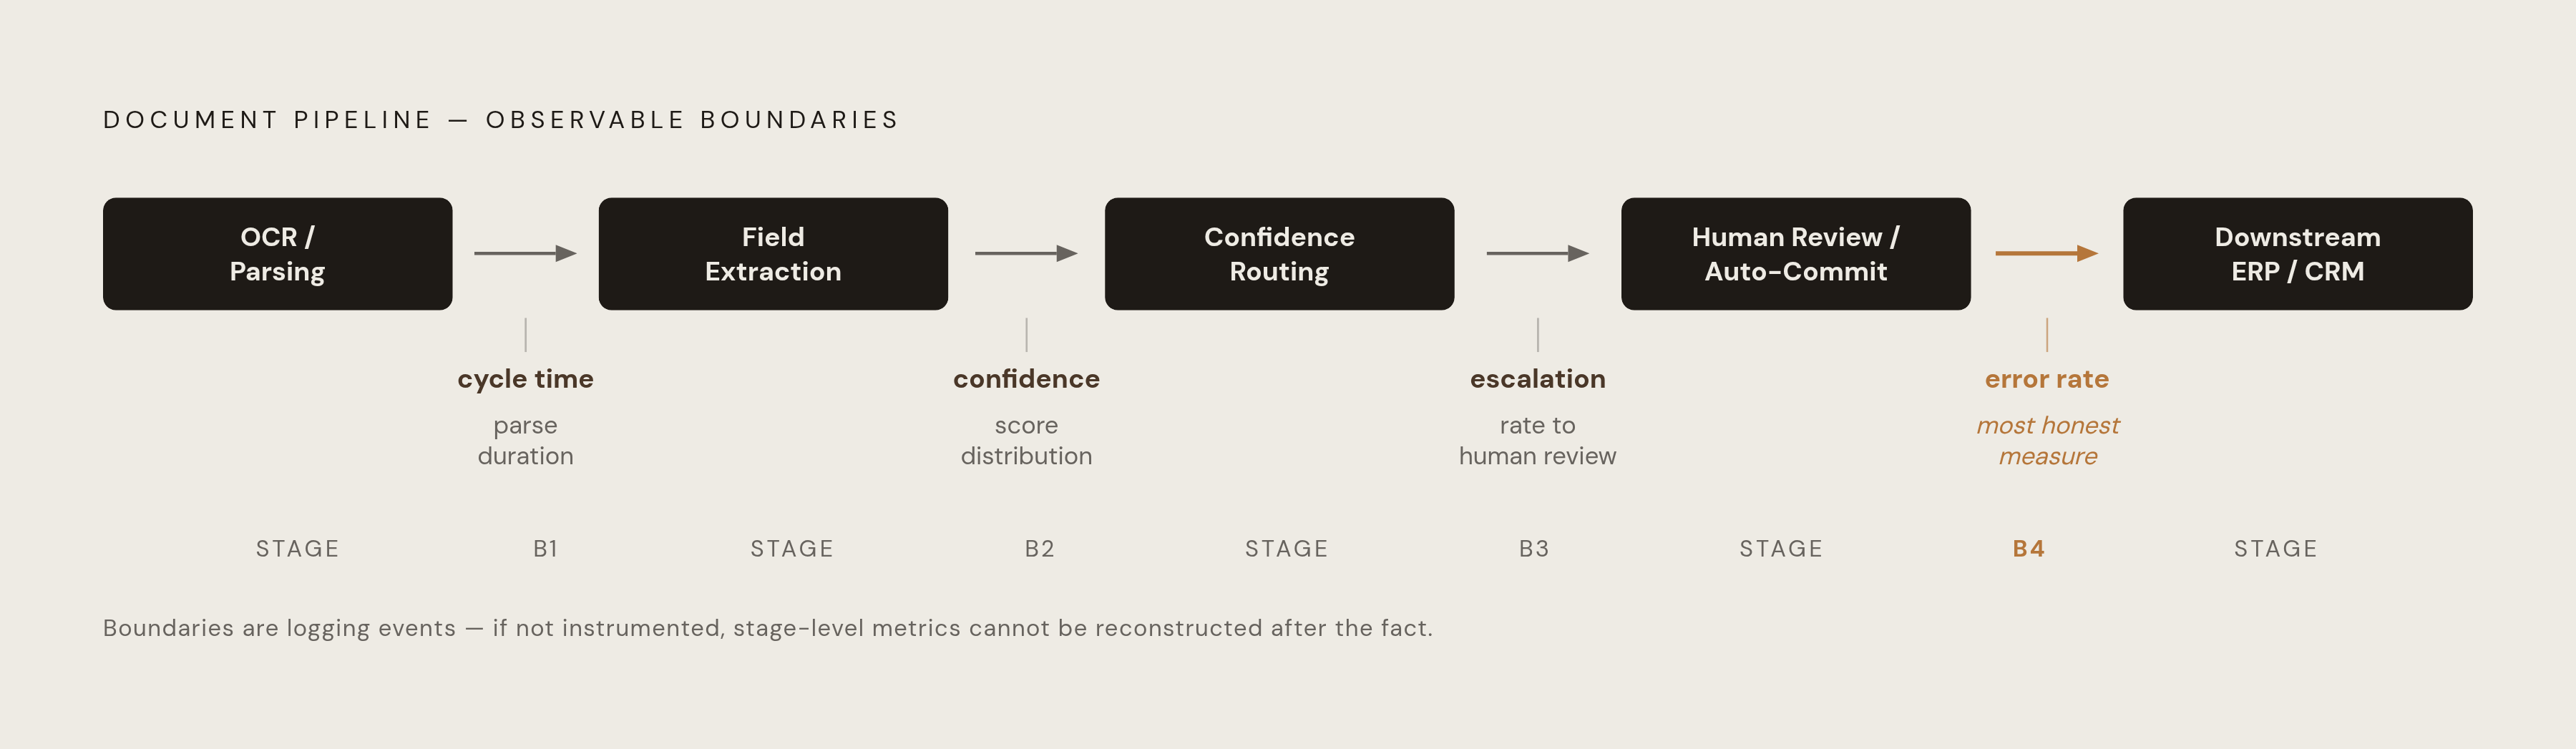
Decisions made at design time determine what can later be measured: teams that put off instrumentation until after deployment often discover that the needed signals were never captured. A typical pipeline runs through OCR or parsing, field extraction, confidence-scored routing, and then either human review or auto-commit, and each boundary between those stages is a natural place to log an event. If teams treat those boundaries as internal plumbing rather than observable events, they can't later compute stage-level cycle time or escalation rates, because the data simply doesn't exist. Confidence scoring has to be built into the extraction layer from the start. If a pipeline produces extractions without calibrated confidence scores, it can't support threshold-based routing, and it can't support the escalation-rate metric either, because there's nothing to set a threshold against. Adding scoring in later means re-instrumenting the extraction layer from scratch. Agentic pipelines raise the bar further: tool-call traces, memory reads and writes, orchestrator decisions, and guardrail invocations all have to be logged as discrete events for the leading indicators described earlier to be computable. Observability platforms will tell you whether the system is running correctly, but they say nothing about whether the people using it have actually changed how they work, which is a separate question that has to be answered with its own signals. Adoption telemetry research argues that you should treat adoption itself as an engineering problem, mapping logged behavior to change-management milestones defined as computable thresholds, but that only works if the production system is built to emit the behavioral data those milestones depend on. The capacity to measure has to be designed into the pipeline, not added to it afterward.
Gains in Healthcare, Finance, and Logistics
Where automation gains appear, and how fast, depends on the complexity of the documents involved and the structure of the workflow around them. High-volume, pattern-stable documents common in finance and logistics tend to improve faster and in ways that are easier to measure than the judgment-heavy documents that dominate healthcare. In healthcare, you find the real production gains in revenue-cycle automation, prior authorization, and structured clinical documentation. Deployment data from 2026 shows that broad autonomous agents and cross-system orchestration in healthcare are still mostly running as demos rather than in production, which leaves an especially wide gap between what gets piloted and what gets measured there. In logistics, order processing, bills of lading, and freight documentation are naturally suited to a fixed pipeline because the volume is high and the structure is stable, and an agentic approach only earns its complexity when the conditional routing logic, deciding what to do based on document content, gets too tangled to maintain as plain code. Across all three industries, the same shift keeps appearing: pipelines are moving from simply extracting a field to understanding a document well enough to act on it. That shift is also what makes the resulting actions harder to measure, since an agentic decision leaves a thinner audit trail than a deterministic extraction does. The practical consequence is that the leading and lagging indicator framework described above can't be applied the same way everywhere. It has to be set up per workflow. A single straight-through-processing rate calculated across a mixed pile of document types hides which specific workflow is actually improving and which one is quietly failing underneath a good-looking average.
Why accuracy benchmarks alone cannot prove pipeline readiness
Published accuracy benchmarks measure how a system performs on benchmark documents, which is a different question from how it will perform on the documents a given company actually processes. As these benchmarks have grown in number, vendor accuracy claims have become harder to trust as procurement evidence, not easier. An accurate figure has to come from an independent test run against documents that genuinely represent the buyer's own workload, and the same argument applies to baselines: a pre-deployment baseline has to reflect the real workflow, and an accuracy validation has to reflect the real document population, or neither one tells you anything useful. Finance documents consistently prove the hardest case. Analysis of document AI leaderboards shows that scores on finance, mortgage, supply-chain, and medical documents diverge sharply between systems, so a vendor that scores well on a general benchmark can still underperform badly on the specific document types a financial services or healthcare team handles every day. Complex layouts, reading order, and the relationships between fields, a header and the line items beneath it, for instance, do more to determine the quality of whatever an agent builds downstream than a single headline extraction score ever will. A pipeline can extract every individual field correctly and still misread how those fields relate to one another, so the output is structurally wrong in a way no downstream agent can repair. Confidence scoring and built-in evaluation loops are what connect a benchmark number to actual operational measurement, turning a one-time accuracy claim into a system that keeps checking itself against the documents it's actually seeing in production, week after week, rather than against the sample it was tested on once before anyone bought it.