Throughput Gain Modeling for Document Automation Projects
Engineer document automation gains by modeling pipeline failure points, not just accuracy rates.

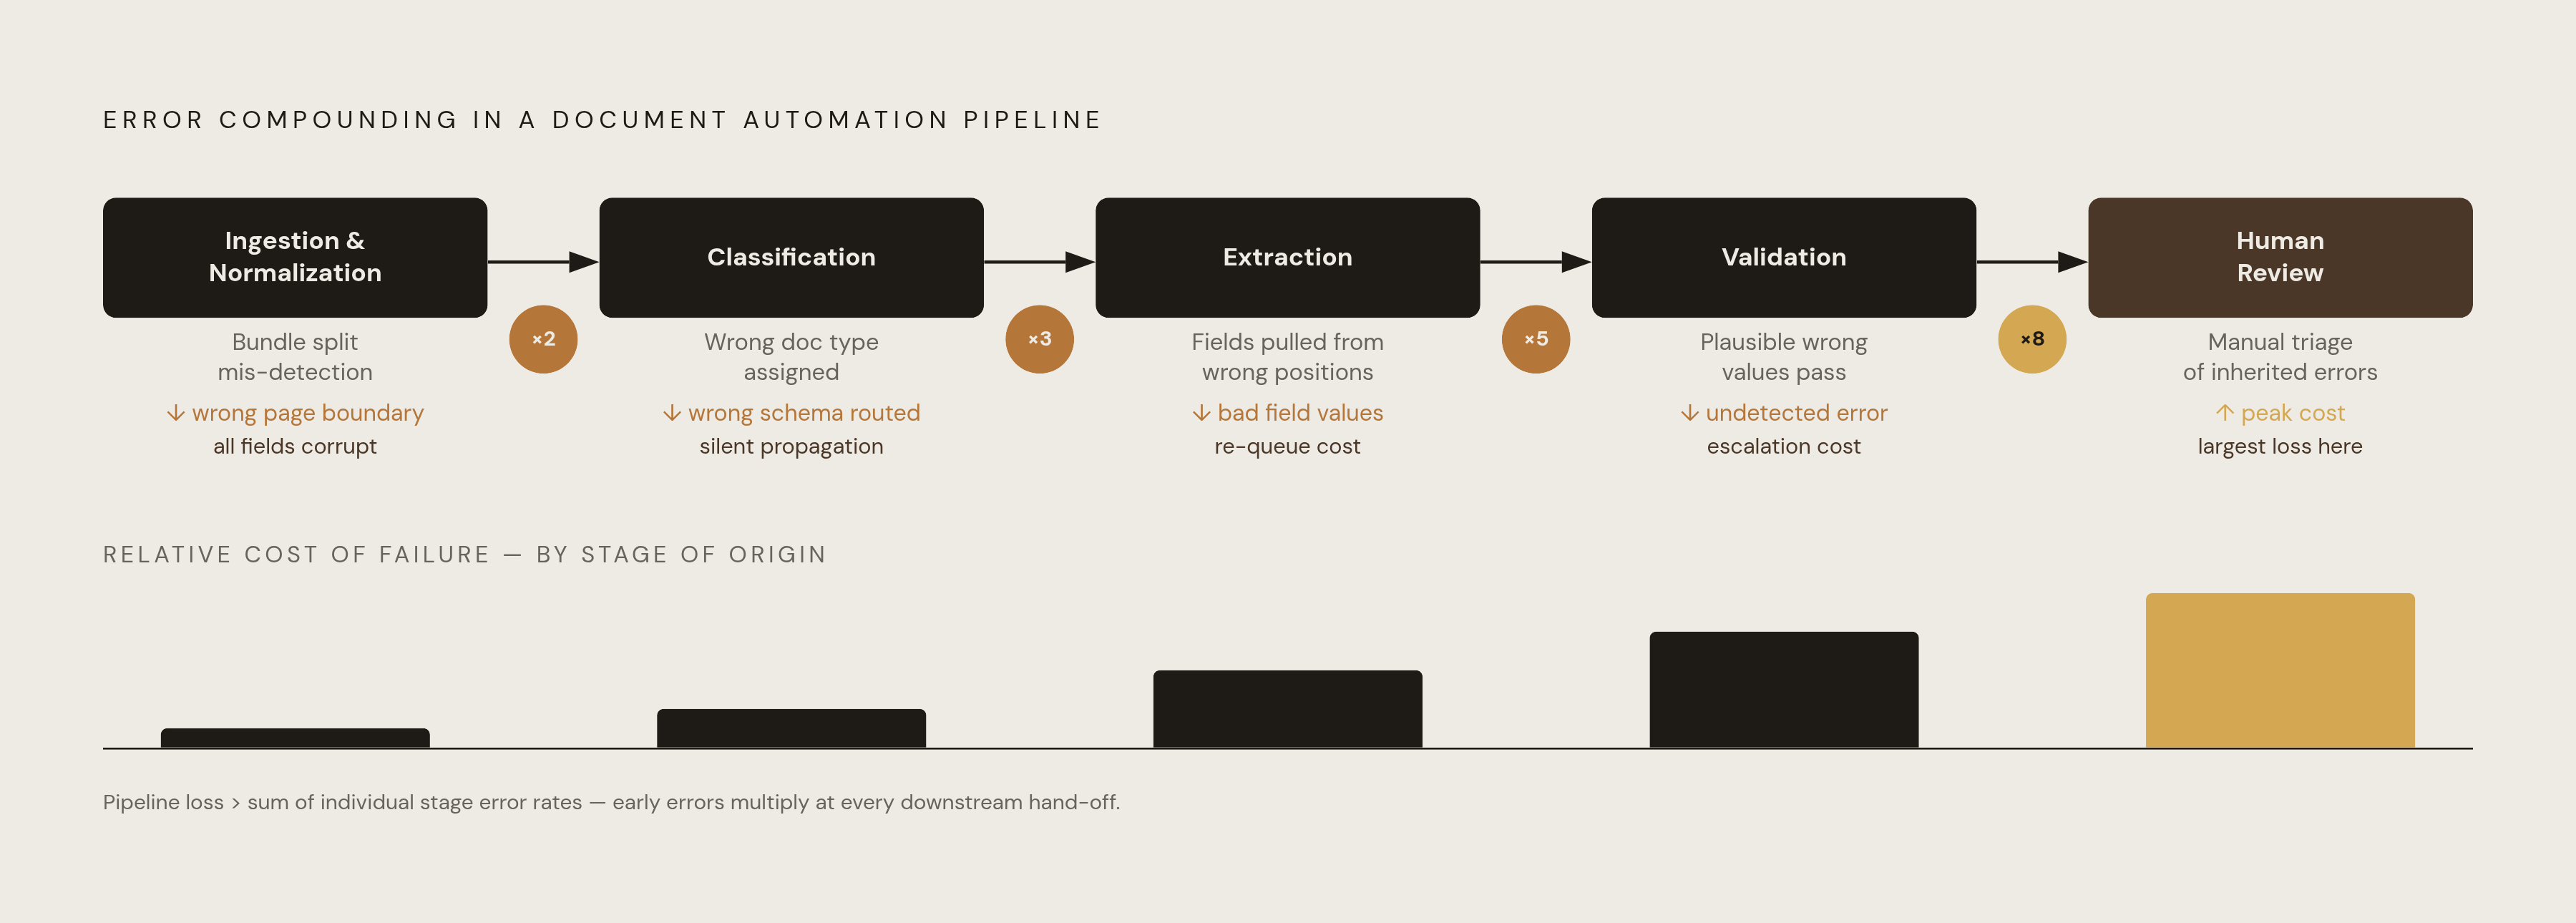
Throughput gain projections for document automation fail for a specific, recurring reason: engineers model the wrong variables, in the wrong order, before they understand where a pipeline actually breaks. The technology itself is rarely the problem. A system that automates extraction at a high accuracy rate can still collapse downstream if splitting runs after extraction instead of before it, feeding the extractor pages from the wrong document on a mixed bundle. Extraction only works if the document in front of it was assembled correctly, and when splitting comes second instead of first, every field pulled from that segment is wrong from the start. Each capability in the pipeline feeds the next, so if a modeling error happens at one layer, it doesn't stay there. It appears multiplied two or three stages downstream, often in a place the original model never accounted for.
A second, quieter failure comes from netting savings against the wrong baseline. If a deployment cuts analyst work a lot but you need a heavy volume of review hours to catch what the system gets wrong, you have to subtract that review cost from the gross reduction to get the real savings. Without a measured starting point, a genuine improvement cannot be told apart from a number that looks good on a slide. This piece argues that gains compound or collapse depending on where accuracy breaks down inside the pipeline, so modeling has to start with the pipeline's failure points, not its headline automation rate.
Baseline cycle time: what to measure before you model anything else
A throughput gain model is only as sound as the baseline it starts from, and most baselines used in document automation business cases are guesses dressed up as numbers. Before anyone estimates a gain, the current state needs to be measured directly: end-to-end cycle time per document type, not an average blended across every format a business handles. Cycle time swings sharply with document complexity, format, and the channel a document arrives through, and collapsing that variation into one number destroys the information a model needs most.
The measurement has to go further than cycle time alone. FTE-hours per document should be tracked by task: ingestion, classification, extraction, validation, exception handling, and downstream data entry. Each of these tasks has its own labor cost, and lumping them together hides which stage is actually consuming the analyst's day. Volume distribution matters just as much as total monthly throughput. Oddly formatted documents are rare and make up only a small fraction of overall volume, but they often eat a disproportionate share of exception-handling time.
Documents rarely arrive clean, and that fact has direct consequences for how a baseline should be built. Handwritten notes, scanned PDFs with poor layouts, and multi-page bundles with no consistent internal structure each demand different processing logic, and their manual cycle times reflect exactly that difficulty. A single blended "average cycle time" masks a distribution that is almost always bimodal: a fast population of clean, simple documents, and a slow population of exceptions that take far longer to process by hand. Automation affects these two populations in very different ways, so a baseline that doesn't separate them will produce a projection that is wrong in two directions at once.
Building a usable baseline means mapping the current-state workflow for each target document type: who receives it, what decisions get made along the way, which systems the data eventually lands in, and what tends to go wrong. Every manual touchpoint in that chain needs to be identified before it can be modeled. From there, document types can be cataloged by volume and manual effort, and scored on impact times feasibility, surfacing the highest-return candidates before any model gets built. The baseline that comes out of this process becomes the denominator against which every projected gain is stated as a ratio, and it gives engineers a reference point for checking whether post-deployment measurement is actually catching real improvement or just noise.
How accuracy at each pipeline stage translates into throughput
Throughput gain is the product of accuracy at each sequential stage of the pipeline, and errors introduced early multiply into larger losses by the time a document reaches the end. Ingestion and normalization set the ceiling for everything that follows: the format variability at intake, PDFs, scanned images, email attachments, handwritten forms, determines what quality of input the rest of the pipeline has to work with. When a document enters the system badly scanned or poorly structured, that flaw stays with it through every stage that comes after.
Classification comes next, and a misclassified document routes to the wrong extraction schema. That error stays hidden until validation downstream catches it, or an agent downstream acts on the wrong data and no one notices, which is worse. Extraction accuracy varies sharply by document type. OCR, vision-language models, and large language models can handle documents that break rule-based systems entirely, but their accuracy profiles differ by format and layout, so a model that performs well on clean invoices may perform far worse on handwritten intake forms. Validation exists specifically to catch what extraction gets wrong: cross-field checks and duplicate checks catch extraction errors before they propagate further, and skipping this stage or underfunding it converts what would have been a contained extraction error into a downstream data quality failure. Routing to human review controls aggregate throughput most directly, because how you calibrate it decides how many documents exit the automated path and how many land in a queue.
Errors compound across these stages. A document that clears ingestion and classification cleanly but fails at extraction has to be re-queued, escalated, or, in the worst case, passed through silently with wrong data attached. Each of those three paths carries a different cost and a different effect on measured throughput. Multi-page bundles introduce a specific version of this risk: if the splitting stage misassigns pages to the wrong document, every field extracted from that mis-split segment is drawn from the wrong source entirely, regardless of how accurate the extraction model itself is. The modeling implication follows directly from this structure: throughput gain has to be projected stage by stage, never as a single blended end-to-end rate. The automation rate at each stage, the error rate that leaks into the next stage, and the volume that lands in human review at each exception point all need their own line in the model.
Exception rates and human-in-the-loop touchpoints as first-class model variables
Exception rates and human review routing are the primary lever that decides whether a projected throughput gain shows up in reality or stays theoretical, not cleanup work handled after deployment. Exception rate measures the fraction of documents that exit the straight-through path and land in a human review queue at any stage of the pipeline. Straight-through processing rate is the fraction of documents that moves end-to-end with no human touchpoint.
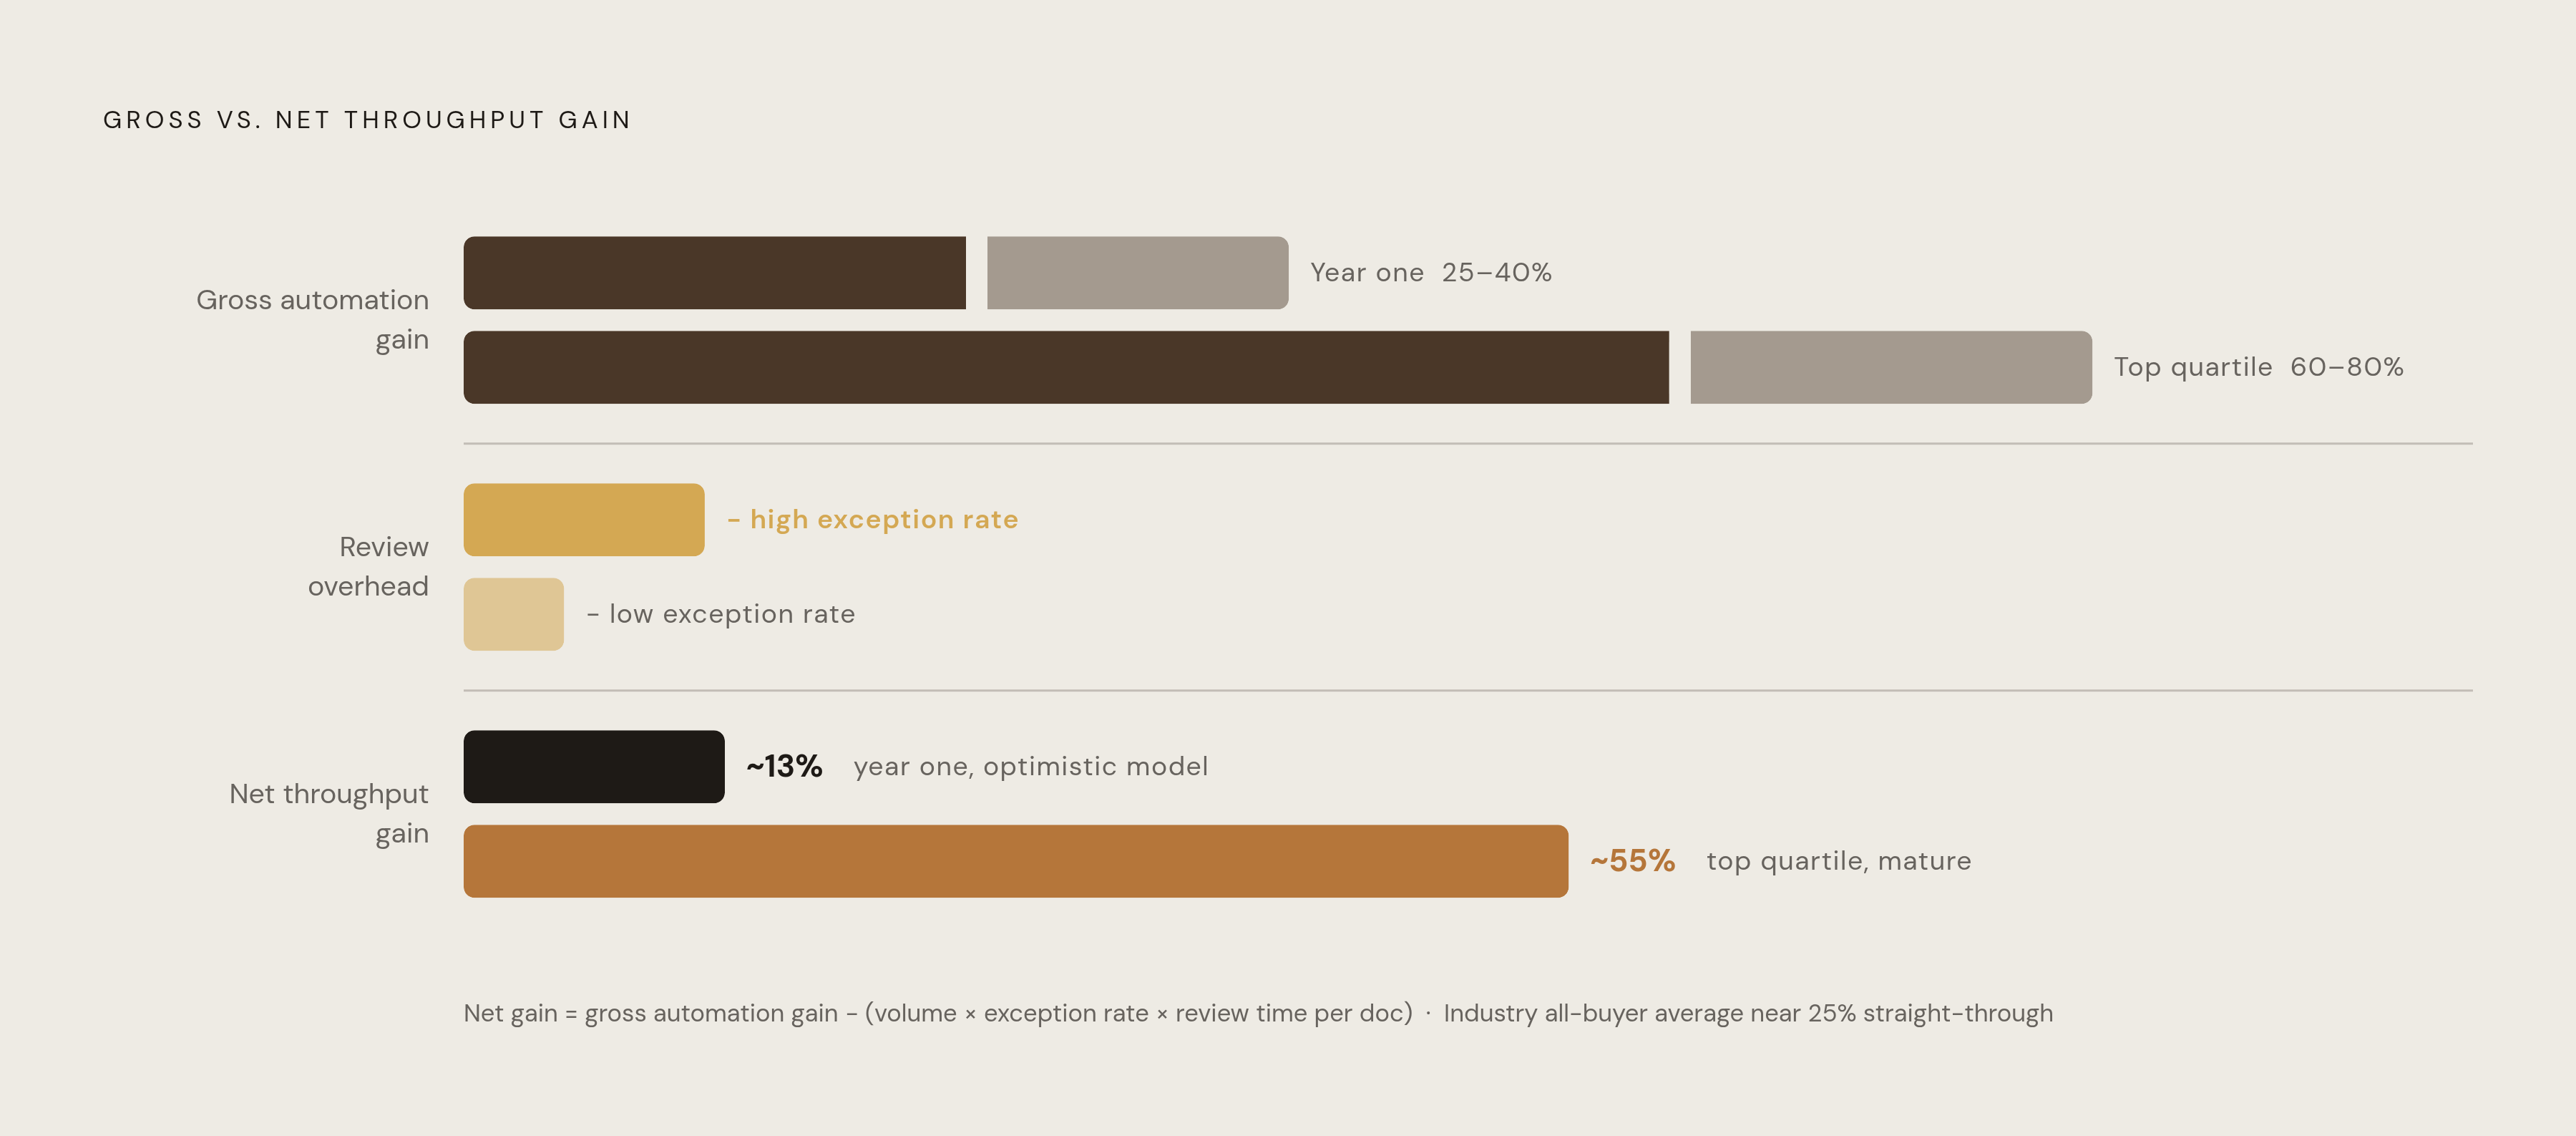
Top-performing enterprises reach touchless rates well above the industry average, but a typical all-buyer average sits closer to 25%. In year one, deployments commonly run 25% to 40% for straight-through processing, well short of the 60% to 80% range that mature, top-quartile implementations eventually reach. The gap between a projected straight-through rate and the rate a deployment actually realizes is where most throughput models fall apart. That rate needs to be modeled as a range from the start, not treated as a single point estimate.
If you model human-in-the-loop touchpoints as a cost variable, you treat every human review as a cycle time charge against the gross gain, not a footnote. The formula is straightforward: volume multiplied by exception rate, multiplied by human review time per document, gives the review overhead in staff-hours of review time. Net throughput gain is gross automation gain minus that review overhead, and this net figure is the only one that should drive staffing and cost projections. A model that reports a large gross automation gain while ignoring that review overhead eats most of it is the "invisible improvement" failure described earlier, now expressed in operational terms.
Confidence thresholds are the design decision that sets exception rates. If you raise the threshold, straight-through errors drop, but human review volume climbs. If you lower it, coverage improves, but more mistakes slip through to downstream systems uncaught. This is a formal engineering tradeoff, not something to tune after the fact, and the threshold has to be set with direct awareness of what downstream agents will do with the data, a point the next section develops further. Routing even a small fraction of low-confidence documents, just the uncertain cases, to human review can raise overall extraction accuracy to a level where downstream automation becomes reliable.
Making this work in production requires a few concrete pieces of infrastructure: confidence thresholds set per field or per document type rather than one blanket threshold across the whole system; review queues with tracked cycle time so review overhead gets measured instead of estimated after the fact; exception routing that tells apart a low-confidence extraction, which is fixable in place, from a classification failure, which requires sending the document back to an earlier stage; and quality assurance sampling that checks whether the straight-through path is producing correct outputs, not just outputs that look complete.
Downstream agent dependencies and the gain calculation
When extracted data feeds a human dashboard, an extraction error costs you just a correction. But when that same data feeds an autonomous agent that takes action, an extraction error costs you a wrong action taken at machine speed, and that difference changes what accuracy the model has to require before deployment. A document workflow that ends in a human reading a structured report can tolerate a higher exception rate, because if an error reaches a person, it gets caught before anything happens. A workflow that triggers downstream automation directly, routing a claim, posting to a ledger, updating a patient record, needs near-zero error rates on the specific fields that drive those actions.
Governance built for this kind of agentic action adds its own throughput cost that the model has to carry. A maker-checker architecture, where one agent proposes an action and a second agent evaluates it before it executes, with human escalation reserved for cases that exceed an iteration cap, is one documented pattern for keeping agentic writes safe. That governance layer adds latency and reduces the effective automation rate for high-stakes actions, and a model that ignores this cost will overstate the achievable gain for any workflow that ends in autonomous execution.
The practical requirement is to identify, for every field an agent consumes, the accuracy that field needs to meet before the action built on it is safe, and apply a tighter confidence threshold and a lower exception tolerance to that field specifically. In a modern pipeline, classification, extraction, validation, and routing each feed the next stage in sequence, and in an agentic stack, the act layer consumes extraction output directly, which collapses the buffer that a human reviewer used to provide. Multi-step agentic pipelines that run extraction, validation, and correction in sequence before handing output to the act layer improve accuracy, but they add their own latency and cost, and both have to appear in the throughput model. For every downstream agent dependency, the model needs to name the fields that agent consumes, the accuracy required for its action to be safe, and the confidence threshold and review routing needed to hit that accuracy, then translate those requirements into a throughput impact.
Building the throughput gain model: variables, sequence, and a worked structure
Everything in the preceding sections resolves into five inputs, which you model in a fixed sequence.
The first input is baseline cycle time per document type, and you measure this rather than assume it, broken down by pipeline stage and manual touchpoint as described earlier. The second is projected automation rate per pipeline stage rather than one blended end-to-end figure: classification automation rate, extraction automation rate, and validation automation rate each modeled on their own, because an error at each of these stages carries a different downstream cost. The third is exception rate and review overhead, calculated as volume multiplied by projected exception rate, multiplied by review time per document, producing staff-hours of review time consumed by human review, which gets subtracted from the gross gain to arrive at net gain. The fourth is the agent dependency map: for each downstream agent, which fields it consumes, what accuracy those fields require, and what confidence threshold and human-in-the-loop cost apply to them specifically, adjusting the exception rate and review overhead upward for the highest-stakes extraction targets. The fifth is compounding error propagation: the share of documents where an error at one stage causes a failure or a re-processing cycle later, and this is what multiplies individual stage error rates into pipeline-level throughput loss.
These five inputs, run in sequence, produce two outputs worth staffing decisions around: a projected straight-through rate expressed as a range rather than a point estimate, with the width of that range driven by the uncertainty in exception rates and field-level accuracy on the actual document types in question, and a net throughput gain stated in staff-hours of review time and cycle time, after review overhead has already been subtracted.
None of this is reliable until it is tested against real production documents, with their actual scan quality, layout inconsistency, and handwriting, rather than clean samples chosen to make a pilot look good. You should run a proof-of-concept on real documents before you commit any projected gain to a business case. Running the new process in parallel with the existing manual process for several weeks gives a direct read on actual exception rates, actual review overhead, and actual straight-through rates, turning the model's projections into confirmed numbers. A platform that provides confidence scoring, built-in evaluation, and observable exception routing as standard features, rather than requiring a team to build that instrumentation from scratch, is what separates a model that can be validated from one an engineering team can only hope was right.
Industry patterns that stress-test the model
Different industries stress different parts of this model, and the gap between projected and realized throughput occurs in a different place in each one. In claims processing, the agent dependency map needs the most attention, because if a claim gets routed and paid automatically on bad extraction data, that produces a financial error that is expensive to unwind after the fact, so the fields driving that routing decision need far higher accuracy than the overall system figure would suggest. In healthcare records processing, exception handling tends to be where projections run optimistic, because handwritten notes and inconsistent scan quality push more volume into the slow, bimodal tail of the baseline than teams expect going in. In accounts payable, the straight-through processing numbers offer the clearest stress test of the model, since the gap between a 25% to 40% year-one outcome and a 60% to 80% top-quartile outcome is large enough that a business case built on the optimistic end of that range, without separately modeling review overhead, will overstate net gain substantially.
Across all three domains, the pattern holds: the model that survives contact with production is the one that treated baseline cycle time, stage-by-stage accuracy, exception rate, and agent dependency as inputs to be measured, not assumptions to be stated. Gains compound when accuracy holds at each stage, but they collapse when an engineer skips the measurement and reaches for a headline number instead.