Error Rate Reduction as a Financial Metric in Document Workflows
Convert accuracy metrics into cost-per-document figures finance can budget.

An engineer presents a high accuracy figure in a budget review. The CFO in the room has no way to act on that number, and the meeting stalls there. A percentage is not a cost. It carries no denominator a finance team can plug into a model, no reference to volume, document mix, correction labor, or what happens three systems downstream when the extraction is wrong. The engineer and the finance leader disagree not about whether accuracy matters but about which unit of measure belongs on a budget line. What follows is the work of converting the metrics engineers already track into the figures finance needs: cost per document, correction labor per period, and the revenue or compliance consequence of a single failure, all denominated in dollars.
The three-layer cost anatomy of a document error
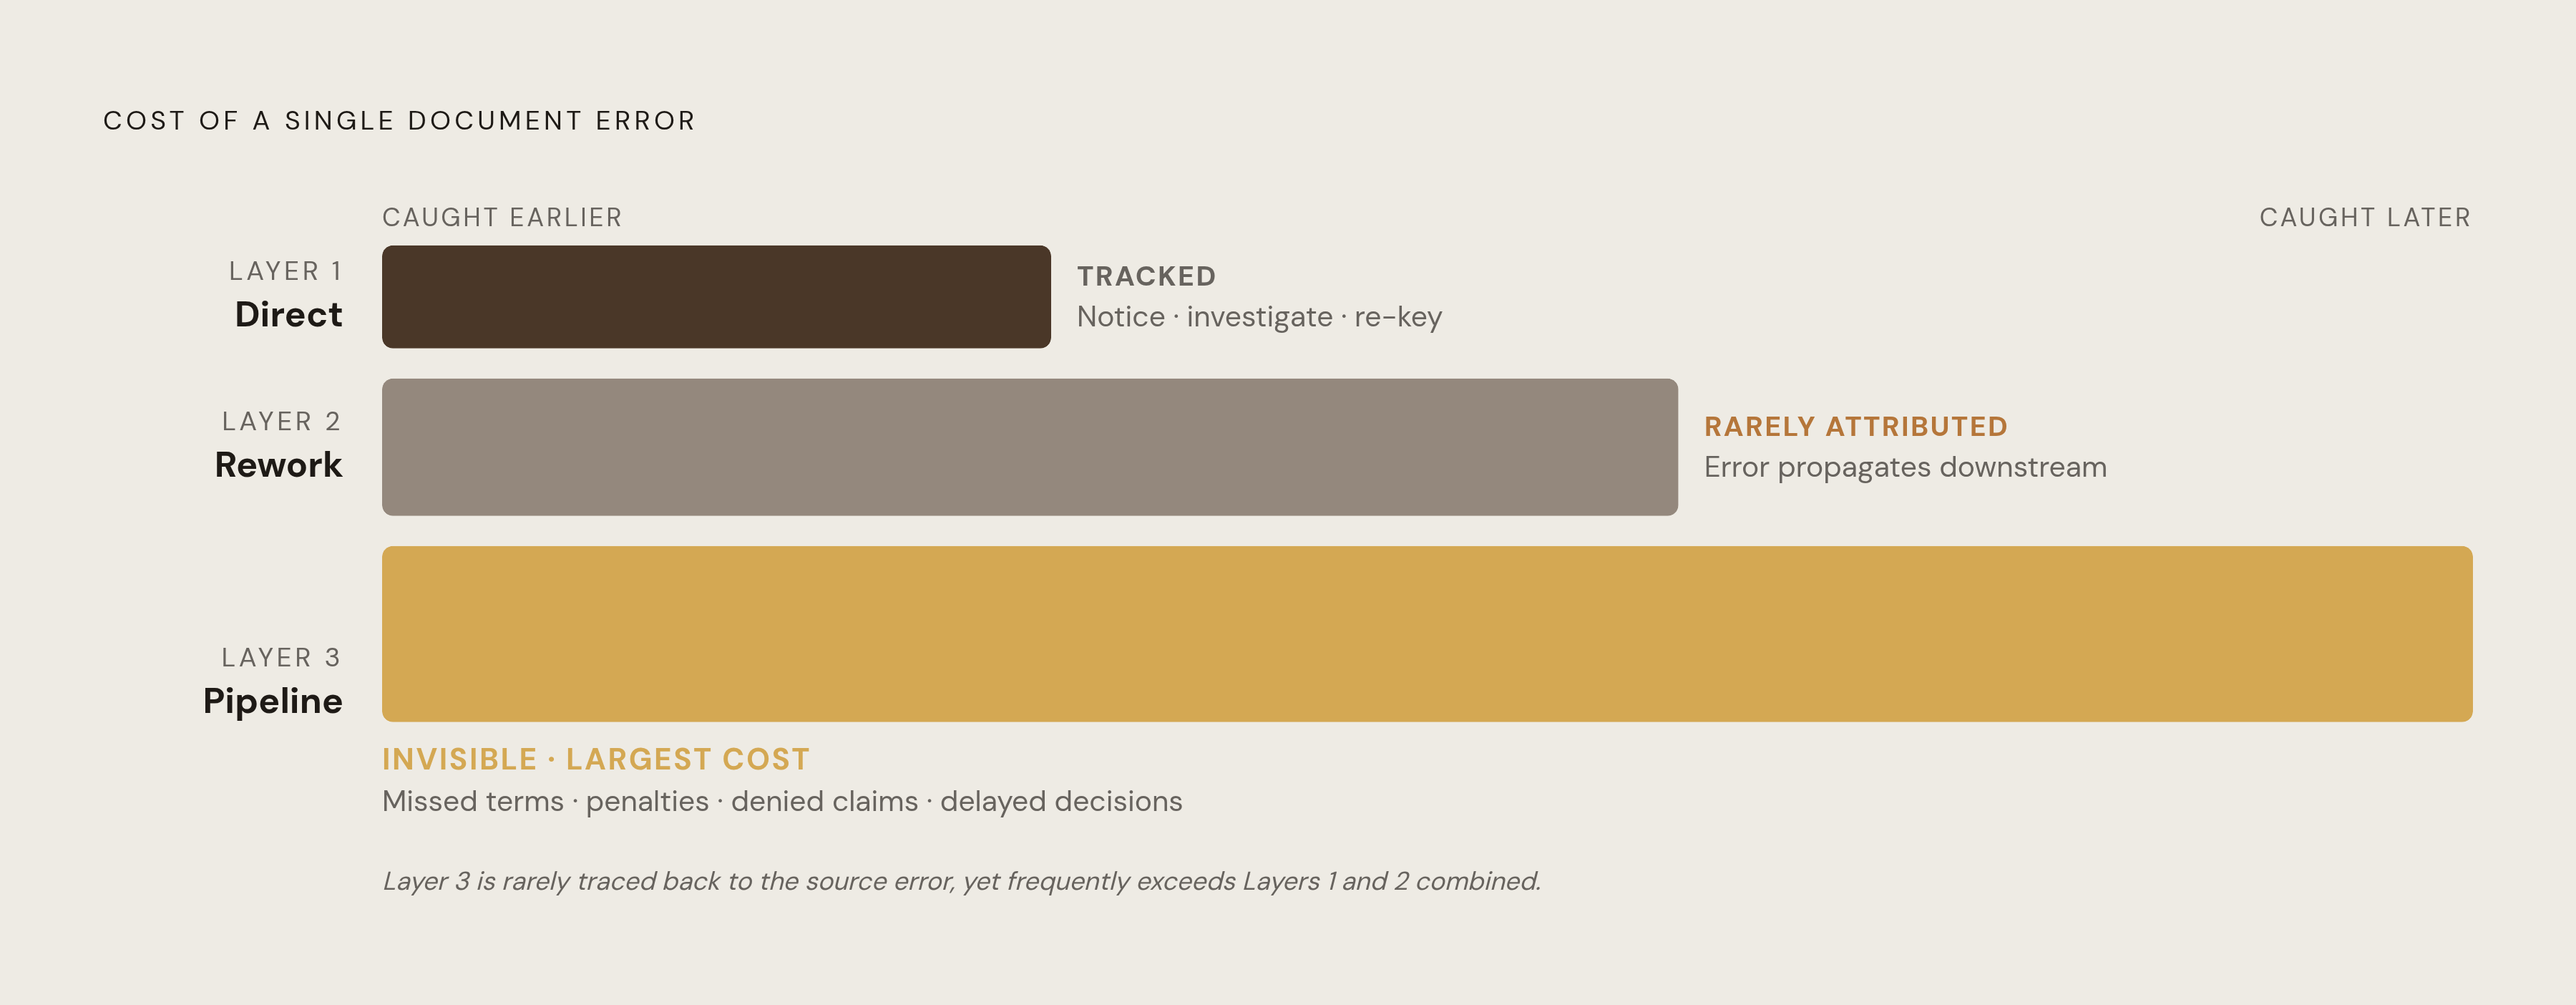
A document error is not a single cost event. The direct correction cost sits at the surface: someone has to notice the error, investigate it, and re-key the correct value. That is the labor line most finance teams already track, because it is the only one that appears as an obvious, attributable expense.
The second layer is rework. The error does not stay contained to the document it started on. It multiplies across every system that trusted the original output.
The third layer is pipeline consequence, and it is usually invisible in error-rate conversations even though it is frequently the largest cost of the three. A missed payment term, a delayed decision, a compliance penalty, a denied claim: these costs rarely get traced back to the document error that caused them, so they stay outside the accuracy discussion.
Consider a single invoice with a misread total. That number first feeds a purchase-order match, where it either fails the match and stalls the invoice, or it passes incorrectly and moves forward. If it reaches payment before anyone catches it, you have to reverse a disbursement, amend a ledger entry, and possibly re-run a reconciliation that already closed. One misread number has now touched three systems and three teams, and the cost of fixing it at the payment stage is substantially higher than the cost of catching it at intake. Each uncaught error seeds further failures in the same processing period, so cost accelerates as volume and error rate interact.
How field-level accuracy obscures the document-level failure rate
Field-level accuracy is the number most vendors and most engineering teams lead with, even though it is the number least connected to what a document workflow actually costs to run. It does not distinguish between a document that passed clean and one that needed a person to step in. It only tells you how often individual values were correct.
The straight-through processing rate closes that gap. STP rate measures the share of documents that get through the entire workflow with no one touching them, and because it counts documents, not fields, it maps directly onto labor cost and throughput. High character accuracy and a sizable human review rate are not in tension once you understand what each metric is measuring. OCR accuracy counts characters. STP rate counts documents that survived the full workflow intact, and that is not the same population.
Part of the reason the two numbers diverge so sharply is structural. A misread field identity is an error of meaning, not a character error. Factura.ai's 2026 analysis of invoice processing accuracy frames this gap in strategic terms: the distance between the accuracy AI systems are technically capable of and the accuracy organizations actually realize in production represents a meaningful competitive opening for firms that close it. The STP gap is an operational inefficiency and a gap competitors can exploit.
Converting STP rate into a cost-per-document figure finance can budget against
Cost per document is the figure that turns an accuracy improvement into something an investment committee can evaluate, because it denominates the current state and the proposed future state in the same unit finance already uses to judge any other infrastructure spend. The formula itself has two inputs: take the total cost of the document processing function, which includes licensing, implementation, and human review labor, and divide it by the number of documents processed in the period. Running that calculation before an accuracy improvement and again after one produces a single comparable number finance can compare directly.
STP rate is what drives the labor side of that equation. At a low STP rate, most documents still need a person to review or correct them, so labor cost dominates the total, and cost per document stays high no matter how efficient the software is. As STP rate climbs, labor cost compresses toward handling only the genuine exceptions, the documents that actually need a human judgment call, and cost per document falls sharply as a result. This is why a proposal built around a small field-level accuracy gain is a hard sell in a budget meeting: a two-point improvement in field accuracy does not translate into a number finance can model. A proposal built around moving STP rate from a low baseline to a materially higher one, with a corresponding drop in cost per document, reads like any other capital investment with a calculable payback period.
Accounts payable automation gives a concrete picture of how this plays out in practice. AI-driven AP tools reach high extraction accuracy, and when organizations automate AP, they report much less processing time per invoice and far fewer errors. Neither change alone is what moves cost per document. The reduction in processing time and the reduction in errors work together: faster processing lowers the labor cost side of the formula, and fewer errors lower the rework and pipeline consequence layers described above, and it is the combination that produces the drop in cost per document that justifies the investment.
Cost-per-document across healthcare, finance, and logistics
The cost-per-document formula stays the same across industries, but the inputs that feed it do not, because document mix, error tolerance, and the cost of downstream failure vary by domain. So the accuracy floor an organization needs to clear before an investment pays off is not a fixed number. It depends on which of the three cost layers dominates in that industry.
In healthcare, the accuracy floor sits highest because layer 3 consequences, denied claims, failed audits, delayed treatment authorizations, carry the largest dollar value of the three layers by a wide margin. Revenue cycle management turns this into a line item: denial rates, days in accounts receivable, and the labor cost of correcting claims all move directly with how accurately clinical documents get extracted.
In accounts payable, layers 1 and 2 dominate the calculation instead. The compliance landscape has added a layer 3 cost to AP that did not exist for most organizations a few years ago: e-invoicing mandates now in effect across dozens of countries mean that an extraction error in an invoice workflow increasingly carries regulatory exposure on top of the financial exposure it already carried, which raises the floor on what counts as an acceptable error rate in AP even where the per-document dollar value is modest.
Confidence scoring as a financial control
A calibrated confidence score functions as a financial control, not merely a quality indicator, because it decides where in the pipeline a correction gets paid for. When an extraction's confidence falls below a set threshold, you route it to a human before it enters downstream systems, so the cost of fixing it gets paid at the cheapest point, intake, rather than after it has already propagated into a ledger entry or a claims system. The entire value of confidence scoring as a financial tool rests on calibration: a confidence score only means something to a budget if the stated confidence level actually predicts correctness in production, so that a score of, say, 90% is right roughly 90% of the time on the documents the organization actually processes, not on whatever test set the model was trained against.
Miscalibration produces two distinct and opposite financial failures. If over-confidence lets low-quality extractions pass the review threshold, they enter downstream systems unflagged, and that generates layer 2 and layer 3 costs at full scale because nobody caught the error before it propagated. Under-confidence has the opposite effect: too many documents get routed to human review even when they did not need it, STP rate stays artificially low, and the labor savings the automation investment was supposed to deliver never materialize. Both failures are costly in different directions, so the threshold itself deserves to be treated as a budget decision rather than a default setting left at whatever the vendor shipped. You set that threshold by weighing the actual cost of a downstream error in a given domain against the cost of an unnecessary human touchpoint, making the human review queue a financially governed exception list.
Benchmark accuracy as a basis for infrastructure investment
The strongest objection to any accuracy investment case is familiar: the current vendor already scores well on its benchmark, so why spend more. The objection fails because benchmark accuracy and production financial performance are measured on different populations of documents, and a score from one population says very little about performance on the other. Vendor benchmark figures used in investment conversations are almost always built on document sets that look nothing like what an organization actually processes, so they give you a weak foundation for projecting what STP rate or cost per document will look like once the system goes live.
Academic and vendor OCR benchmarks typically test clean, typed text with consistent layouts, and that is the easiest case a document system can face. Production workflows look nothing like that: scanned PDFs with skew and degraded ink, documents mixing handwriting and type, multi-column layouts where field identity depends on position rather than content, and tables nested across page breaks. Models that score well on the clean benchmark regularly underperform on exactly this kind of document, because the benchmark never tested for it. The financial consequence is concrete: a system with a high score on a general benchmark can post a lower STP rate on an organization's actual document mix than a competing system that scored lower on the same benchmark but was evaluated against documents closer to what that organization actually processes.
Benchmark score and production STP rate are two different measurements taken on two different populations of documents, and neither one substitutes for the other. An investment case built on leaderboard position is built on the wrong evidence. The sounder foundation is production-representative accuracy data, meaning performance measured on the organization's own document types, its own layouts, and its own mix of clean and degraded inputs, because that is the only population whose numbers will match what the finance model needs.
Building a financial model for an accuracy improvement investment
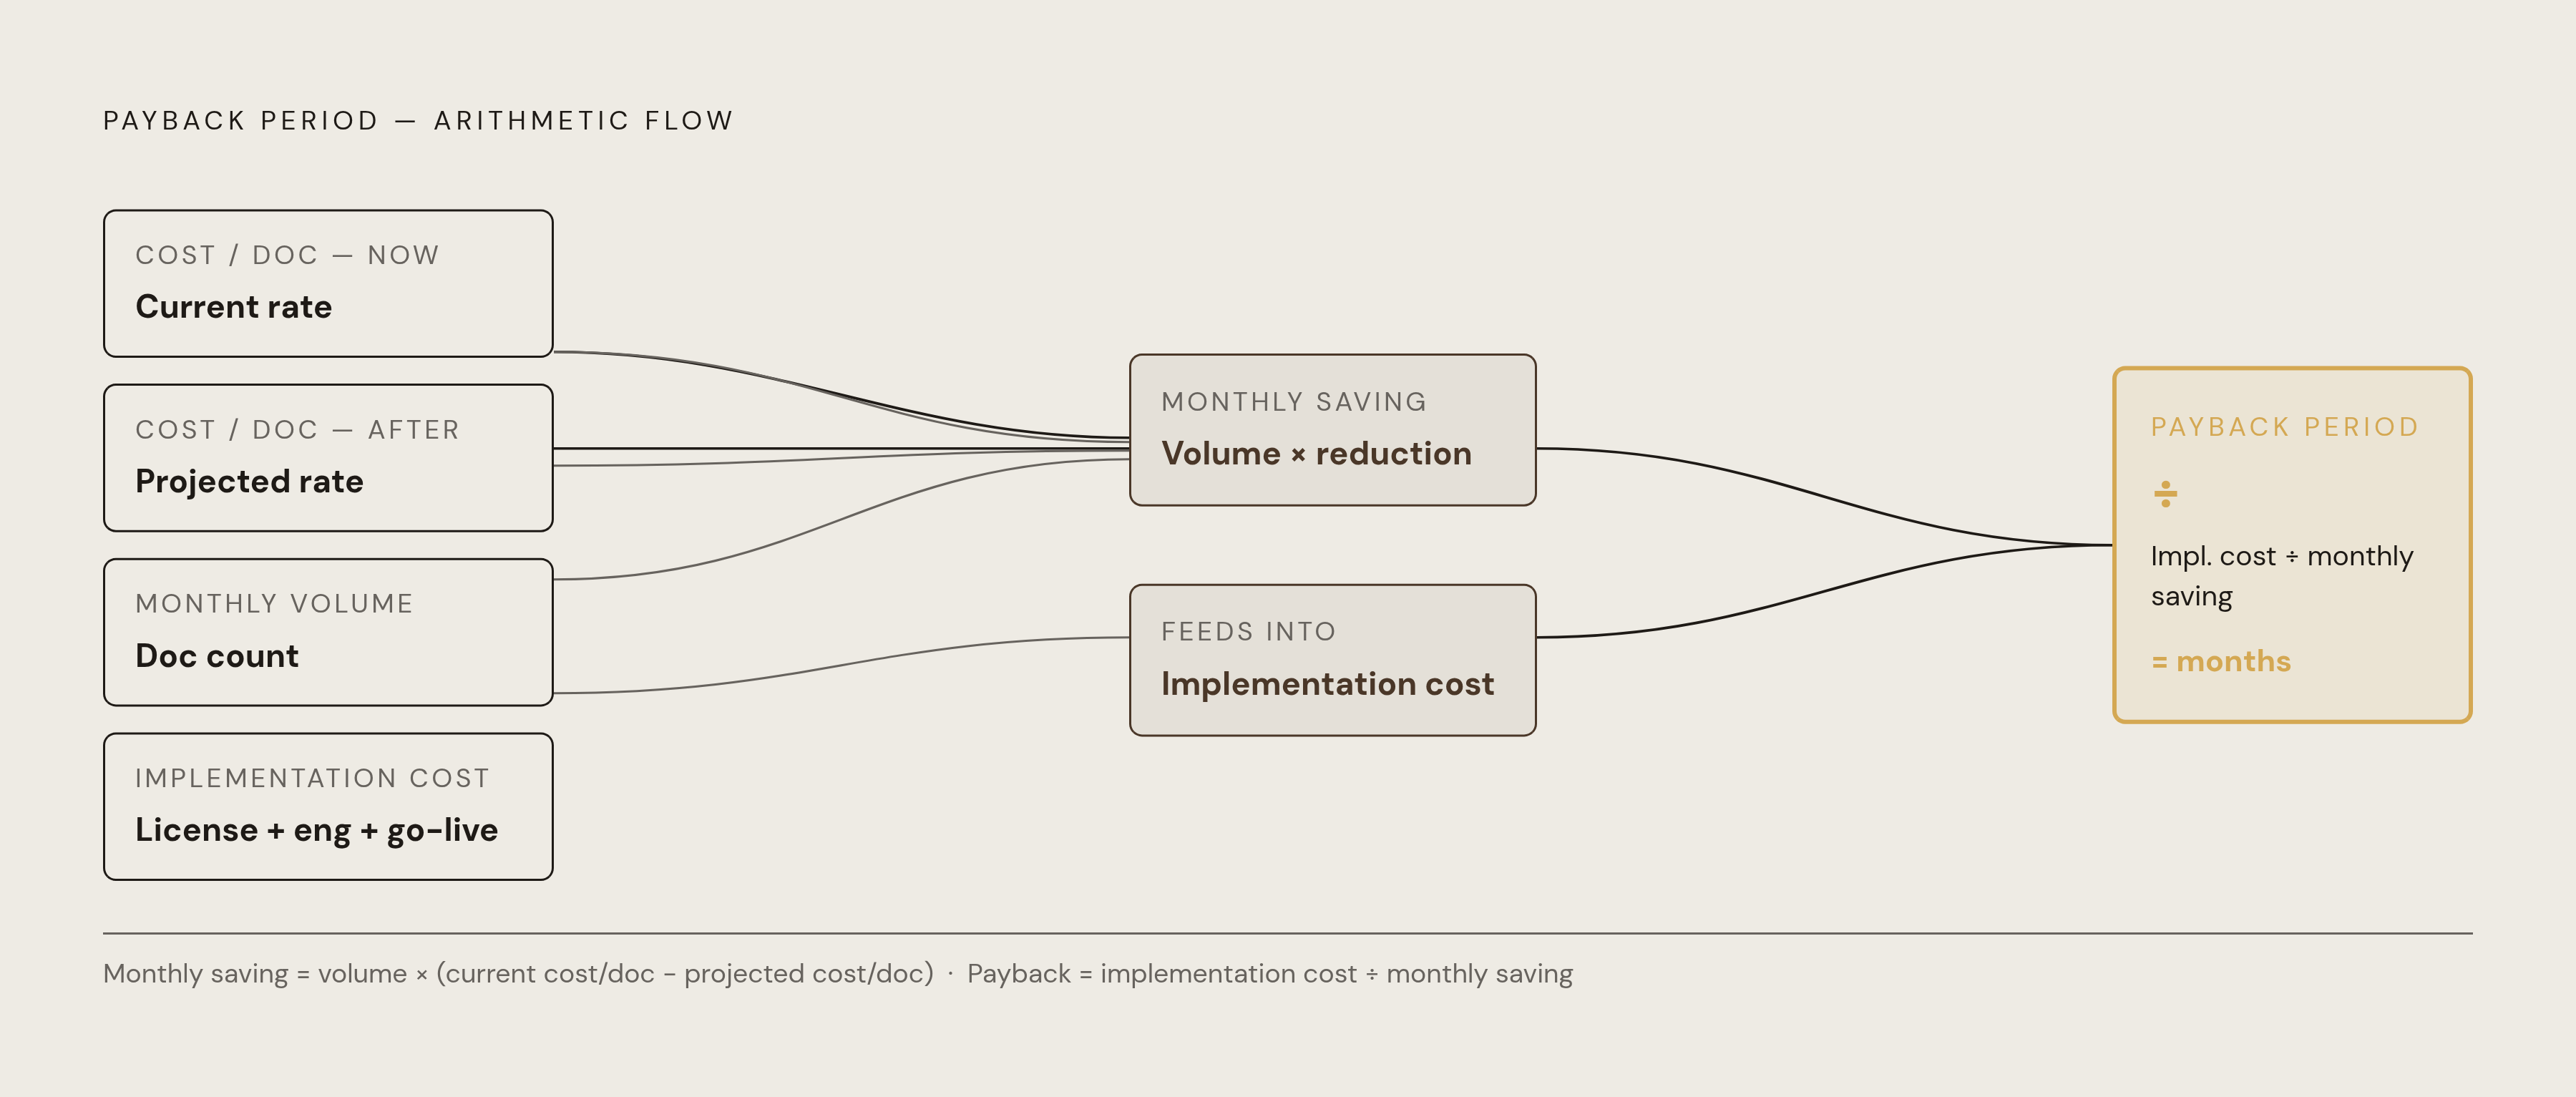
Everything in the preceding sections converges on four measurable inputs: current cost per document, projected cost per document after the proposed accuracy improvement, monthly document volume, and the cost of implementing the change. Once you have those four numbers, the rest is arithmetic.
Building the model well requires gathering a few things first, at the right level of granularity. STP rate should be measured by document type rather than as a single aggregate figure, because the mix of document types determines where the cost actually sits, and an aggregate number hides exactly the high-consequence documents that matter most. The fully loaded cost of a human review touchpoint in the relevant workflow needs to be established directly, since that figure is what the labor side of the cost-per-document formula depends on. The cost of a downstream error needs to be estimated in two parts: the correction labor that layer 2 rework requires, and a conservative estimate of layer 3 consequence, such as a denial rate, a penalty rate, or a delay cost, for the document types where stakes run highest. Finally, implementation cost needs to be priced out in full, covering licensing, the engineering time required for integration, and the cost of going live, and that figure compresses considerably when the platform under consideration offers pre-built APIs and SDK support in standard languages rather than requiring custom integration work from scratch.
With those inputs assembled, the payback period calculation follows directly: take the monthly saving, which is document volume multiplied by the reduction in cost per document, and divide that figure into the total implementation cost to get a payback period expressed in months. For most document operations running at moderate to high volume, that payback period clears a reasonable hurdle rate, and you don't need to stretch any of the assumptions. The model is actually strongest where it is most conservative. Layer 3 costs get excluded from most models simply because they are hard to attribute cleanly to a single document error, and a model that leaves those costs out entirely and still produces a short payback period makes a more credible case to an investment committee than one that leans on hard-to-verify downstream estimates to make the numbers work. The case for accuracy investment does not need the generous assumptions. It holds up on the conservative ones.